Creating easy reports with pivot tables
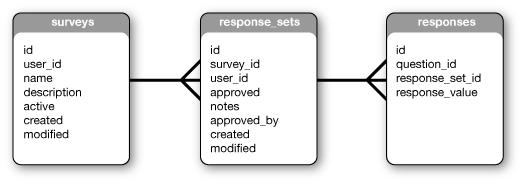
I’ve been working on a project that collects various surveys and stores the data very much like below.

While this is a data structure is very normalized and provides a flexible base to build various surveys with. What it does not provide is an easy interface for building reports. Lets say our client wants some metrics on a few of the questions. We want to generate a table that looks like this.
| Total Question 10 | Total Question 20 | Total Question 30 | Total Surveys |
|---|---|---|---|
| 1200 | 4000 | 5000 | 30 |
A plain jane query on our response_sets and responses table can get various joins of the data-set but often we will have to sift through all the records with our programming language and compute the totals there. My queries were looking something like this.
- SELECT response_value
- FROM responses AS r
- LEFT JOIN response_sets AS rs ON rs.id = r.response_set_id
- WHERE rs.survey_id = 3
- AND r.question_id = 10;
I would run a query like this for each question I wanted and then compute the total in the application. This was becoming a slow and in-efficient method as the number of rows grew, and I knew there had to be a better way.
An Easier way
A better way was out there so I did some research on translating rows to columns and ended up reading about pivot tables. A pivot table is not a table per-se but a query that can be used to pivot a table around a certain condition. Now the SQL is lengthy but runs surprisingly fast. Furthermore, all the required results I defined above can be retrieved in one query.
- SELECT
- SUM(IF(question_id = 10, response_value, 0)) AS question10
- , SUM(IF(question_id = 20, response_value, 0)) AS question20
- , SUM(IF(question_id = 30, response_value, 0)) AS question30
- , COUNT(DISTINCT response_sets.id) AS total_surveys
- FROM responses AS r
- INNER JOIN response_sets AS rs ON rs.id = r.response_set_id
- WHERE rs.survey_id = 3
- GROUP BY rs.survey_id;
How it works
A pivot table query works by using a foreign key to rotate the data. Each SUM(IF()) statement compares the current row to the condition. If the condition passes — meaning it is a row we are interested in — the value of the field is added to a running total. Not only can we generate totals for specific questions on surveys that match a certain criteria but we can also generate averages or grand totals.
- , SUM(IF(question_id = 10, response_text, 0)) / COUNT(DISTINCT response_sets.id) AS question10_Avg
Adding that line to our previous query would give us the average value of question 10 as well. In my application this offloaded a fair bit of application code off to the database server. In addition, these pivot table queries are fast, on my local machine the query described above runs in under 0.03 sec. The individual queries I first started using were taking ~0.06 sec each and then further time was spent processing them. So there is a big performance increase as well as an increase in flexibility. As the report generation is contained by the query and not application code.
To read more on this subject read MySql/Pivot table
This is pretty sweet thanks! I have been wanting to implement something similar, great research thanks :)
anonymous user on 8/1/08